"Today’s rate of increase is more than 100 times faster than the increase that occurred when the last ice age ended."
~ NOAA Media Release (2013)
~ Scripps (SIO UCSD) News Release (2013)
Atmospheric CO2 is rising at an unprecedented rates. Consequences are profound for earth's temperatures, climates, ecosystems and species, both on land and in the oceans. To see whether the speeding rise of atmospheric CO2 is slowing or speeding up, take a look at the bend in the iconic Keeling Curve. Or, is the rate of change speeding up or slowing down? The answer can be seen in the direction of the bend in the Keeling Curve. And it can be seen in the data that produces the Keeling Curve.
Atmospheric CO2 Growth Rates
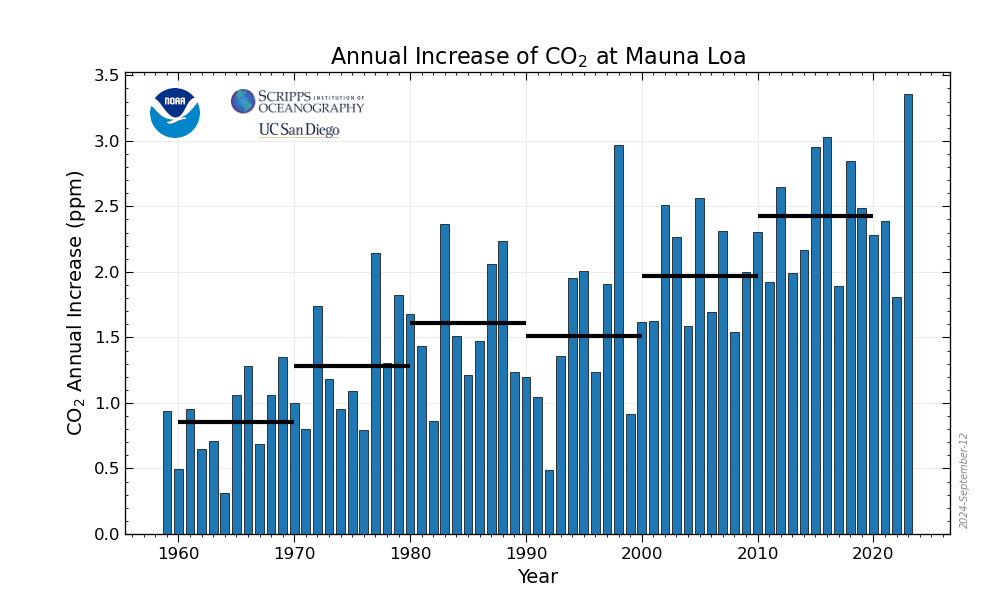
Decadal Average Annual Growth Rates
Mauna Loa Observatory (MLO)
1961 - 2020
Decade |
Atmospheric CO2
Growth Rate(ppm per year) |
| 2011 - 2020 | 2.43 |
| 2001 - 2010 | 2.04 |
| 1991 - 2000 | 1.55 |
| 1981 - 1990 | 1.56 |
| 1971 - 1980 | 1.35 |
| 1961 - 1970 | 0.91 |
ppm = parts per million
data updated January 5, 2022
Decadal changes calculated by CO2.Earth
with NOAA-ESRL annual mean CO2 concentrations at Mauna Loa.
Annual Growth
-
Annual CO2 Growth Rates
NOAA-ESRL charts the annual growth rate for atmospheric CO2 at Mauna Loa. The table below shows the average annual increase (blue bars) and the average for each decade (black horizontal bars).
 source graphic NOAA-ESRL [.png + web]
Links
NOAA-ESRL Annual mean CO2 growth rate at Mauna Loa [.txt data]
NOAA-ESRL Annual mean global CO2 growth rate [.txt data]
Keeling Curve
-
Scripps UCSD maintain the iconic Keeling Curve named after Charles David Keeling, the scientist who created an instrument to make high-precision measurements of the concentration of carbon dioxide in air. The accelerating increases shown in the data can be seen in the Keeling Curve graph as a bend upward to the left.
Links
Scripps CO2 Program The early Keeling Curve
Scripps CO2 Program Keeling Curve lessons
Keeling Curve 2015 Is the rate of CO2 growth slowing or speeding up?
Keeling Curve 2015 American Chemical Society to honor Keeling Curve
Keeling Curve 2015 What does this number mean?
Scripps CO2 Program Mauna Loa graphics gallery
Related
CO2.Earth 1958: Keeling discovers background CO2
Climate Central 2013 Keeling Curve
Inter-related Trends
Scripps O2 Program Scripps O2 global oxygen measurements
Scripps CO2 Program Mauna Loa CO2 & Fossil Fuel Trend (graphic)
Bend the Keeling Curve
U of Cal. 2015 Bending curve on climate change for California and the world
***
-
Related
The Conversation | Existential risks to our planetary life-support systems (2013)
CO2 Data
CO2.Earth Daily CO2 Data
CO2.Earth Weekly CO2 Data
CO2.Earth Monthly CO2 Data
CO2.Earth Yearly CO2 Data
CO2.Earth Global Temperature
CO2.Earth Global Carbon Emissions


