Earth's CO2 Home Page
Atmospheric CO2
February 2024
427.09
parts per million (ppm)
Mauna Loa Observatory, Hawaii (NOAA)
Preliminary data released March 5, 2025
Keeling Curve Monthly

CO2 Data
NOAA Trends in atmospheric CO2
Scripps UCSD Keeling Curve + Scripps CO2 Program
CO2.earth (reposted data) Daily CO2 | Weekly CO2 | Monthly CO2 | Annual CO2
CO2.earth Track The Trend
Show the Trend
Show.earth Add a 'KC Monthly' CO2 widget to your site or blog
Global Temperatures
December 2024 Global Temperature Change
+1.55°C
2nd Warmest December since 1880
CSAS / GISS data retrieved March 5, 2025
- The Earth's global average surface temperature in December 2024 was 1.55°C above the average for the pre-industrial comparison period of 1880-1920.
- December 2024 was the second warmest December since 1880 when records began.
- The global average temperature for December over the last 10 years is 1.26°C above the the 1880 -1920 baseline average for December.
Global Monthly Average Temperatures
1880 to Present Relative to 1880-1920 Baseline Average
(a better proxy for pre-industrial temperatures)

This graph by Columbia University replaces the traditional 1951-1980 baseline period with 1880-1920 for the reasons given in "A Better Graph." The graph is produced by Climate Science, Awareness, and Solutions (CSAS) at Columbia University, and also available as a PDF. Data presented above is sourced from the 2024 monthly temperature data table published by CSAS. Additional information and baseline comparisons are available on the Global Temperature page of the Columbia University website.
Monthly global temperature data and reports
This global temperature update originates from Climate Science, Awareness and Solutions (CSAS) in the Earth Institute at Columbia University, New York, USA. The update presents an analysis by NASA's Goddard Institute for Space Studies (GISS) of near-global temperature data from 1880 to 2022.
This CO2.Earth page is prepared independently. However, reasons for featuring global temperature comparisons with averages for 1880-1920 period are explained in the 2016 paper, A better graph by Dr. James Hansen and Dr. Makiko Sato.
Source data and related information are linked below.
Columbia Climate School / CSAS / GISS Temperature & climate data and information
- Alerts: CSAS Monthly global average temperature reports: 2015 to present
- Links More CSAS climate data, research, books and other links (Sato & Hansen)
- Climate communications page of Dr. James Hansen
NASA GISS Source data analysis
- Data Global temperature index relative to 1951-1980 baseline
- Info Surface temperature analysis (GISTEMP)
- Info Updates regarding the NOAA GHCN v4 and ERSST v5. analysis of global temperature data
- Info & data More NASA Goddard datasets & images
NOAA NCEI Source dataset information
- Global historical climatology network monthly (GHCNm) dataset
- Extended reconstructed sea surface temperature (ERSST) dataset
NOAA-NCEI Global temperature updates and climate analysis
*Note: NOAA-NCEI reports temperature increases relative to the 20th Century global average surface temperature, not pre-industrial levels.
2024 Global Temperature
+1.56°C
Relative to the 1880-1920 average
Warmest year since 1880
The global average temperature in 2024 was 1.56°C warmer than the pre-industrial baseline average for 1880-1920. It was the warmest year on record since 1880. Annual temperature and ranking data are posted as a table by CSAS at Columbia University.
CSAS Earth Institute annual update: January 12, 2024
"Global temperature in the GISS analysis increased 0.28°C in 2023, from 1.16°C to 1.44°C, the largest annual increase in the 144-year record. This annual rise is largely due to the ongoing tropical El Nino warming, but no prior El Nino engendered as much warming, which points to an additional drive for global warming acceleration. We have argued3 that the imminent threat of human-made climate change is understated in IPCC4 assessments, which are based predominately on global climate models (GCMs)."
To read more about past, present and projected temperature changes and the main drivers, read Global warming acceleration: Causes and consequences by Hansen et al., 2024.
Columbia Climate School / CSAS / GISS Annual temperature data & analysis
- Recent data Annual global temperature relative to 1880-1920 & ranking: recent years (from NASA GISS analysis)
Recent Annual Global Temperature Reports
Berkeley Earth 2023 2022 2021 2020 2019
Columbia Climate School / CSAS / GISS 2023 2022 2021 2020 2019
NOAA NCEI 2023 2022 2021 2020 2019
Regional Temperature Changes
Berkeley Earth Cities (temperature changes since 1960)
Berkeley Earth Countries (emissions and temperature changes to 2020 with projections for 2100)
Recent Annual Global Temperature Reports
- May 16, 2024: Comments on Global Warming Acceleration, Sulfur Emissions, Observations by Hansen et al (CSAS)
-
Apr 4 2024: Factcheck: Why the recent ‘acceleration’ in global warming is what scientists expect by Hausfather (Carbon Brief)
- Apr 4 2024: Much ado about acceleration by Gavin Schmidt
-
Mar 29 2024: Global Warming Acceleration: Hope vs Hopium by Hansen et al (CSAS)
- Feb 14 2024: Shock as warming accelerates, 1.5°C is breached faster than forecast by Spratt & Dunlop
- Jan 12 2024: Global Warming Acceleration: Causes and Consequences by Hansen et al (CSAS)
Acceleration in Global Warming
Columbia University Reports Observed Acceleration in Global Warming
Paper by J. Hansen and M. Sato
December 14, 2020
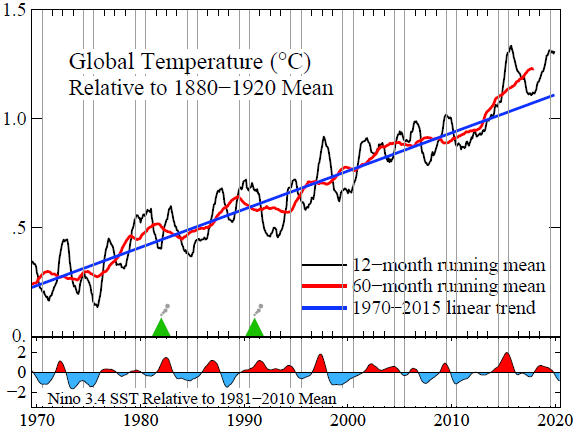
Global temperature and Niño3.4 SST (through to November 2020)
December 14 2020: Abstract
Record global temperature in 2020, despite a strong La Niña in recent months, reaffirms a global warming acceleration that is too large to be unforced noise – it implies an increased growth rate of the total global climate forcing and Earth’s energy imbalance. Growth of measured forcings (greenhouse gases plus solar irradiance) decreased during the period of increased warming, implying that atmospheric aerosols probably decreased in the past decade. There is a need for accurate aerosol measurements and improved monitoring of Earth’s energy imbalance.
November 2020 was the warmest November in the period of instrumental data, thus jumping 2020 ahead of 2016 in the 11-month averages. December 2016 was relatively cool, so it is clear that 2020 will slightly edge 2016 for the warmest year, at least in the GISTEMP analysis. The rate of global warming accelerated in the past 6-7 years (Fig. 2). The deviation of the 5-year (60 month) running mean from the linear warming rate is large and persistent; it implies an increase in the net climate forcing and Earth’s energy imbalance, which drive global warming.
>> Source: Global Warming Acceleration by Hansen & Sato, 2020
>> Recent comment on acceleration: See Global warming acceleration: Causes and consequences by Hansen et al., 2024.
Projections for Global Average Temperature in 2024
Berkeley Earth (Jan. 2024):
It is "very likely that 2024 will become either the warmest of 2nd warmest year on record."
Based on historical variability and current conditions, it is possible to roughly estimate what global mean temperature might be expected in 2024. Our current estimate is that 2024 is likely to be similar to 2023 or slightly warmer. With the ongoing El Niño conditions, and the typical lag between peak El Niño and peak global temperature response, it is likely that 2024 remains relatively warm. However, a swing towards La Niña in late 2024 is possible and could ultimately serve to mitigate temperatures some. The swings from El Niño to La Niña and back again are the largest source of predictable interannual variability in the global temperature record.
We predict a 58% chance that 2024 is warmer than 2023 and 97% chance that it is at least as warm as 2016, making it very likely that 2024 will become either the warmest or 2nd warmest year on record.
Columbia Climate School / CSAS (Jan. 2022):
"It will be clear that the world is passing through the 1.5°C ceiling, and is headed much higher, unless steps are taken to affect Earth’s energy imbalance."
We expect record monthly temperatures to continue into mid-2024 due to the present large planetary energy imbalance, with the 12-month running-mean global temperature reaching +1.6-1.7°C relative to 1880-1920 and falling to only +1.4 ± 0.1°C during the following La Nina. Considering the large planetary
energy imbalance, it will be clear that the world is passing through the 1.5°C ceiling, and is headed much higher, unless steps are taken to affect Earth’s energy imbalance.
....
How do we know global temperature will continue to grow in the next 5-8 months, carrying the 12- month running-mean to at least 1.6-1.7°C? The main reason is the large increase of global absorbed solar radiation (ASR) since 2015 (Fig. 4), which is a decrease of Earth’s albedo (reflectivity) by 0.4% (1.4/340).9 This reduced albedo is equivalent to a sudden increase of atmospheric CO2 from 420 to 530 ppm. Increase of EEI (Fig. 5) is smaller than the increase of ASR because the warming increases thermal emission to space. The increase of ASR since 2015 is particularly important because it acts as a “fresh forcing,” regardless of whether it is a forcing, a persistent feedback, or a combination thereof. Given the absence of monitoring of global aerosol forcing, ASR provides our best clue as to the changing drives for global warming. These assertions warrant discussion.
Projections From the Recent Past
"Globally-averaged temperatures in 2015 shattered the previous mark set in 2014 by 0.23 degrees Fahrenheit (0.13 Celsius). Only once before, in 1998, has the new record been greater than the old record by this much."
~ NASA Goddard Institute for Space Studies [NASA post of January 20, 2016]
Before the end of 2015, scientists projected that average global temperature increase for 2015 will exceed 1°C above pre-industrial levels. The years 1850-1900 are used as the pre-industrial baseline by the MET Office and Climate Research Unit at the University of East Anglia in the UK. The MET Office released this statement in November 2015:
"This year marks an important first but that doesn't necessarily mean every year from now on will be a degree or more above pre-industrial levels, as natural variability will still play a role in determining the temperature in any given year. As the world continues to warm in the coming decades, however, we will see more and more years passing the 1 degree marker - eventually it will become the norm."
~ Peter Stott
Head of Climate Monitoring and Attribution (MET Office)
