2022 Mauna Loa Eruption and Interruption of Leading CO2 Signal

By Michael McGee
Published: December 4, 2022.
Last updated: April 24, 2023
Introduction
The Mauna Loa volcano erupted November 27, 2022. About seven hours later, lava flows buried the access road and cut electrical powerlines to the remote, world-famous Mauna Loa Observatory.
This global atmosphere monitoring facility is best known for producing the longest running record of high-precision measurements of CO2 levels in the Earth's atmosphere. This incident caused a pause in CO2 measurement programs at Mauna Loa: the NOAA CO2 monitoring program (NOAA GML), and the Scripps CO2 monitoring program (Scripps / UCSD).
The eruption lasted about two weeks. Volcanic activity began to settle down on December 9, 2022, and lava flows stopped expanding by December 13, 2022. The USGS reported that lava flows travelled 12.1 miles and covered an area of 16.5 square miles.
To continue the Mauna Loa CO2 record, temporary measurement site was set up at the nearby summit of Maunakea. NOAA began its Maunakea measurements on December 8, 2022. Scripps began its measurements at this temporary site on December 14, 2022. The two monitoring programs will continue the Maunakea measurements for about a year after measurements resume at the Mauna Loa facility. This will provide an overlap which will allow scientists to compare measurements at the two nearby locations.
On March 9, 2023, Scripps resumed its measurements of CO2 levels at the Mauna Loa Observatory. As of April 24, 2023, it is not yet known when NOAA will resume its CO2 measurements at Mauna Loa.
This page
A more detailed account of events is next. Then, links to external reports and coverage is listed in chronological order.
Detailed Story & Comment
Since March 1958, scientists have been using high-precision instruments to measure carbon dioxide (CO2) in the air at the remote Mauna Loa Observatory (MLO) in Hawaii. Located 3,400 metres above sea level, this atmospheric research facility is home to the world's longest-running instrument record for CO2 measurements. This CO2 record generated the Keeling Curve which is now "an icon of modern climate science" (ACS). It resulted in discoveries that advanced human understanding of our impact on the atmosphere, climate and environment--and our capacity to address the impacts.
Mauna Loa is also the world's erupted on November 27, 2022 at 11:30 p.m. At about 6:30 p.m. the next day, lava flows cut through powerlines on the Observatory Road access route which supplies electricity to the nearby Mauna Loa Observatory (MLO). This is the remote, premiere atmospheric monitoring observatory which scientists have been using to monitor and collect data for understanding changes to the planet's atmosphere and climate since the 1950s.
This webpage presents a summary and many links to informaiton the 2022 volcanic eruption at Mauna Loa which interrupted the atmospheric CO2 record which serves as the leading signal of coming changes in climates and environments worldwide, and which, we hope, will soon straighten and bend down to become a signal that shows past and coming progess to resolve the current crisis.
CO2 Proxy Data
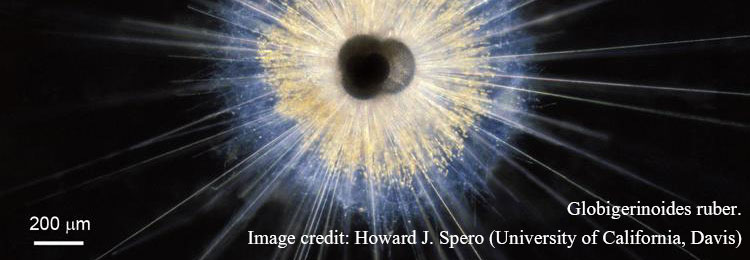
image source Smithsonian national museum of natural history
This colourful foraminifera, a Globigerinoides ruber (G. ruber), was found about 3 meters below the ocean surface near the coast of Puerto Rico. The dark shell at the centre is surrounded by symbiotic algae (the tiny yellow dots) and spines that will fall off when it dies, leaving the shell alone to be preserved in the fossil record. In fact, some ancient ancestors of this G. ruber enabled scientists to double the CO2 proxy record beyond the current 1 million-year age limit for ice cores.
Ice core records provide a high-resolution proxy record of past atmospheres and climates. Scientists combine many types of proxy records to reconstruct environmental conditions from thousands to many millions of years ago. Other examples of proxy evidence include sediments in lakes and oceans, and micro fossils. Multiple records are integrated with observations of the contemporary earth sysem to reconstruct past atmospheres and climates. This scientific work expands our understanding of how the earth system works and it helps predict future climates.
Of significance to the composition of past atmospheres, Bärbel Hönisch and other scientists (2009) analyzed a sediment core taken from the bottom of the Atlantic ocean west of Sierra Leone. From the ancient shells of G. ruber in the sediment core, they developed a high-resolution record of oxygen isotopes (δ18O). This provided evidene showing, among other things, that atmospheric CO2 levels fluctuated between 213 ppm (+30/-28) and 283 ppm (+30/-32) during the period from 900,000 years ago to 2.1 million years ago. This is similar to the range of 172 to 300 ppm established by the ice core record.
Hönisch and her co-investigators did not have air bubbles that were older than 800,000 years. The relied on less direct, geological evidence, to enhance and extend the resolution of knowledge about oceanic and atmospheric CO2 levels by more than a milllion years into 'deep time.'
As for climate states between 2.6 and 5.3 million years ago, during the Pliocene Epoch, atmospheric CO2 levels appear comparable to today, and models suggest that global temperatures were 3°C to 4°C warmer than pre-industrial climates (Yhang et al., 2014). In 2020, a study centred on CO2 in vascular plants from terrestrial sediments found that CO2 has remained below present-day levels for at least the past 7 million years, and potentially for the past 23 million years (Cui et al., 2020).
Scientists have studied the history of this planet since its formation 4.54 billion years ago. Evidence suggests that it has likely been millions of years since atmospheric CO2 and global temperatures were higher than they are today (Hönisch et al., 2009; Yhang et al., 2013; Zhang et al, 2014). As we learn about the past, the facts of warmer climates so long ago has less immediate relevance for our species that emerged just 200,000 years ago. It has less relevance for the stable conditions in which civilization developed over the past 12,000 years.
"If humanity wishes to preserve a planet similar to that on which civilization developed and to which life on Earth is adapted, paleoclimate evidence and ongoing climate change suggest that CO2 will need to be reduced from its current 385 ppm to at most 350 ppm."
~ James Hansen et al. (2008)
Articles
Science Daily Jun 2020 | Today's atmospheric CO2 levels greater than 23 million-year record
Geology 2020 | A 23 m.y. record of low atmospheric CO2
Science Daily 2009 [Release] CO2 higher today than last 2.1 million years
Earth Institute Columbia U. 2009 CO2 higher today than last 2.1 million years
National Geographic 2009 CO2 levels highest in two million years
AGW Observer Papers on atmospheric CO2 from proxies [until 2011]
USGS 2007 Divisions of geologic time
References
Cui, Y., Schubert, B.A., Jahren, A.H. (2020). A 23 m.y. record of low atmospheric CO2. Geology. doi: https://doi.org/10.1130/G47681.1 [pdf]
Hansen, J., Sato, M., Kharecha, P., Beerling, D., Berner, R., Masson-Delmotte, V., . . . Zachos, J. C. (2008). Target atmospheric CO2: Where should humanity aim? [arXiv:0804.1126, physics.ao-ph]. Open Science Atmospheric Journal, 2, 217-231. doi:10.2174/1874282300802010217 [source + .pdf]
Hönisch, B., Hemming, N. G., Archer, D., Siddall, M., & McManus, J. F. (2009). Atmospheric carbon dioxide concentration across the Mid-Pleistocene Transition. Science, 324(5934), 1551-1554. doi:10.1126/science.1171477 [source + researchgate .pdf]
Zhang, Y. G., Pagani, M., Liu, Z., Bohaty, S. M., & DeConto, R. (2013). A 40-million-year history of atmospheric CO2. Philosophical Transactions of the Royal Society of London A: Mathematical, Physical and Engineering Sciences, 371(2001), 1-20. doi:10.1098/rsta.2013.0096 [source + .pdf]
Zhang, Y. G., Pagani, M., & Liu, Z. (2014). A 12-million-year temperature history of the tropical Pacific Ocean. Science, 344(6179), 84-87. doi:10.1126/science.1246172 [source + columbia u .pdf]
Past 23 Million Years (Land Plant Data)
In 2020, a study centred on CO2 in vascular plants from terrestrial sediments found that CO2 has remained below present-day levels for at least the past 7 million years, and potentially for the past 23 million years (Cui et al., 2020). Further, the study states that "The major reorganizations of plant, animal, and hominid ecosystems were not driven by large-amplitude changes in CO2. More meaningful, perhaps, is the inference that these reorganizations could have impelled, or been impelled by, relatively small-amplitude changes in CO2." The paper gives us a new CO2 “timeline” showing no evidence of past fluctuations in CO2 that might be comparable to the dramatic CO2 increase of the present day. This finding suggests that today’s abrupt greenhouse disruption is unique across recent geologic history.
Cui et al 2020 - A 23 million-year record of low atmospheric CO2
https://pubs.geoscienceworld.org/gsa/geology/article/doi/10.1130/G47681.1/586769/A-23-m-y-record-of-low-atmospheric-CO2
https://www.geosociety.org/GSA/News/pr/2020/20-17.aspx
https://www.sciencedaily.com/releases/2020/06/200601194144.htm
geosociety.orggeosociety.org
GSA News Release 20-17
Study Shows Today’s Atmospheric Carbon Dioxide Levels Greater than the Past 23 Million-Year Record
ScienceDaily
Today's atmospheric carbon dioxide levels greater than 23 million-year record
A common message in use to convey the seriousness of climate change to the public is: 'Carbon dioxide levels are higher today than they have been for the past one million years!' This new study used a novel method to conclude that today's carbon dioxide (CO2) levels are actually higher than they have been for the past 23 million years.
Cui, Y., Schubert, B.A., Jahren, A.H. (2020). A 23 m.y. record of low atmospheric CO2. Geology. doi: https://doi.org/10.1130/G47681.1 [pdf]
Civilization & Temperature
Human civilization emerged about 12,000 years ago. Socieiteis have developed during a period of relative climate stability when variations in average global temperature were less than temperature changes projected to occur this century.

source image SkS [web + article + .jpeg]
Links
SkS 2012 We've been through climate changes before
RealClimate 2013 Paleoclimate: The end of the Holocene [graph by Marcott et al.]
Paleoclimate Data
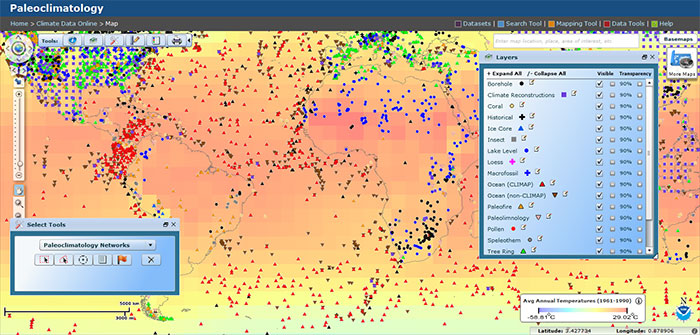
Interactive World Map of Paleoclimate Study Locations (2015 Screenshot)
Source Image Interactive Map Tool [hi-rez image] via NOAA-NCDC Datasets Web Page
Data and Info
NOAA-NCDC Ice core datasets at the World Data Center
NOAA-NCDC Paleoclimate datasets
NOAA-NCDC Climae data online (including recent data)
Historical CO2 Datasets
This page of data links was started to help you find the source dataset you are looking for.
CO2 Data | Years 0 to 2014
Datasets are compiled by the Institute for Atmospheric and Climate Science (IAC) at Eidgenössische Technische Hochschule in Zürich, Switzerland.
IAC Switzerland Global CO2 Yearly [excel]
IAC Switzerland Global CO2 Monthly [excel]
CO2 Data Pages
Scripps UCSD Mauna Loa CO2 Data + Primary Mauna Loa CO2
NOAA-ESRL Trends in CO2 + CO2 Data
CO2.earth Yearly CO2 + Monthly CO2 + Daily CO2
More Data and Info
NOAA-NCDC Ice core datasets at the World Data Center
NOAA-NCDC Paleoclimate datasets
NOAA-NCDC Climate data online (including recent data)
CO2 Ice Core Data
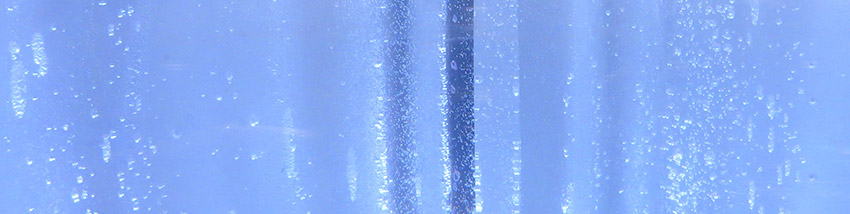
Greenland Ice Core at American Museum of Natural History, New York (image cropped)
Source Image Eden, Janine & Jim | CC BY 2.0
The farther backward you can look,
the farther forward you are likely to see.
~ Winston Churchill
Homo sapiens appeared in our present form about 200,000 years ago. Human civilization emerged about 12,000 years ago. The study of past CO2 levels and climates helps us undersand the conditions in which human societies developed. This 'paleoclimate' information offers important lessons for understanding sustainability and the range of climatic conditions that human societies are known to be suited for.
To understand past climates, ice cores provide a high-resolution record of key climate variables that span the period in which homo sapiens appeared and human civilization developed. Aside from the high-precision CO2 measurements that Charles David Keeling started at the South Pole in 1957 and the Mauna Loa Observatory in 1958, ice cores are the best source of atmospheric CO2 data for the prior 1 million years.
Scientists have been drilling ice sheets and analyzing the ice cores since the 1950s, particularly in Antarctica and Greenland. Areas with accumulating snow turn to ice with air bubbles that preserve samples of the atmosphere from world atmospheres of the past. Scientists are able to analyze the cores to learn about past changes in the concentration of atmospheric gases and the glacial-interglacial cycles for the past million years.
Here, use the CO2 data and graphs to explore changes in the past, from a thousand to a million years before present.
Ice Core Research
NOAA NCEI Ice core data
NOAA NCEI NOAA paleoclimatology ice core datasets
NSIDC Antarctic Glaciological Data Center
EGU 2013 Finding a 1.5 million-year record of earth's climate
Articles
NASA 2005 Paleoclimatology: The Ice Core Record
SkS We've been through climate changes before
1,000 Years CO2 Data (papers: 1989-1997)
Three ice cores drilled at Law Dome, East Antarctica from 1987 to 1993 resulted in atmospheric CO2 records from 1006 A.D. to 1978 A.D.
The records extend into recent decades for which instrument measurements of atmospheric CO2 levels occured. This was enabled because of the high rate of snow accumulation at the Law Dome drill sites. Scientists reported that the air enclosed in the three ice cores have unparralleled age resolution.
Uncertainty in the data is 1.2 parts per million (ppm). Pre-industrial CO2 levels range from 275 to 284 ppm. Lower levels occured between 1550 and 1800 A.D. These ice cores show major growth in atmospheric CO2 levels in the industrial period except 1935-1945 A.D. when levels stabilized or decreased slightly.

Source Graph Etheridge et al. (via CDIAC)
Link
CDIAC Historical CO2 records from Law Dome ice cores
CDIAC Data | Etheridget et al. (1998)
CDIAC Graphics
NOAA-NCDC Composite Data | 0 - 800 KYr [Excel]
Reference
D.M. Etheridge, L.P. Steele, R.L. Langenfelds, R.J. Francey, J.-M. Barnola and V.I. Morgan. 1998. Historical CO2 records from the Law Dome DE08, DE08-2, and DSS ice cores. In Trends: A Compendium of Data on Global Change. Carbon Dioxide Information Analysis Center, Oak Ridge National Laboratory, U.S. Department of Energy, Oak Ridge, Tenn., U.S.A.
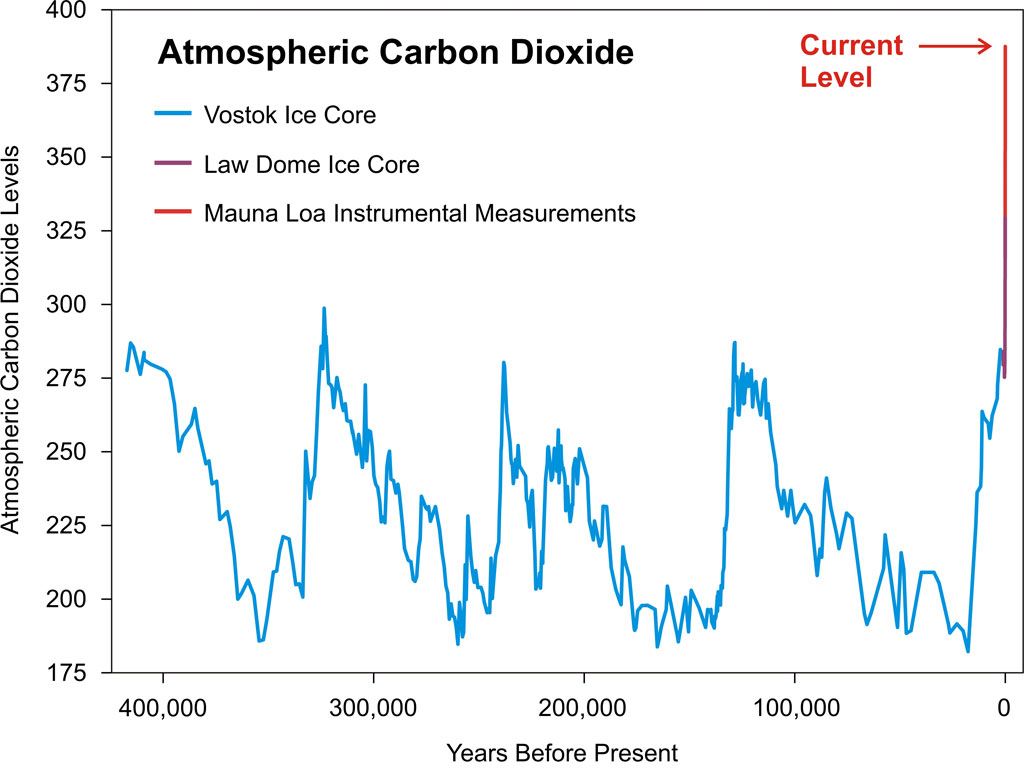
400,000 Years CO2 Data (papers: 1999 to 2005)
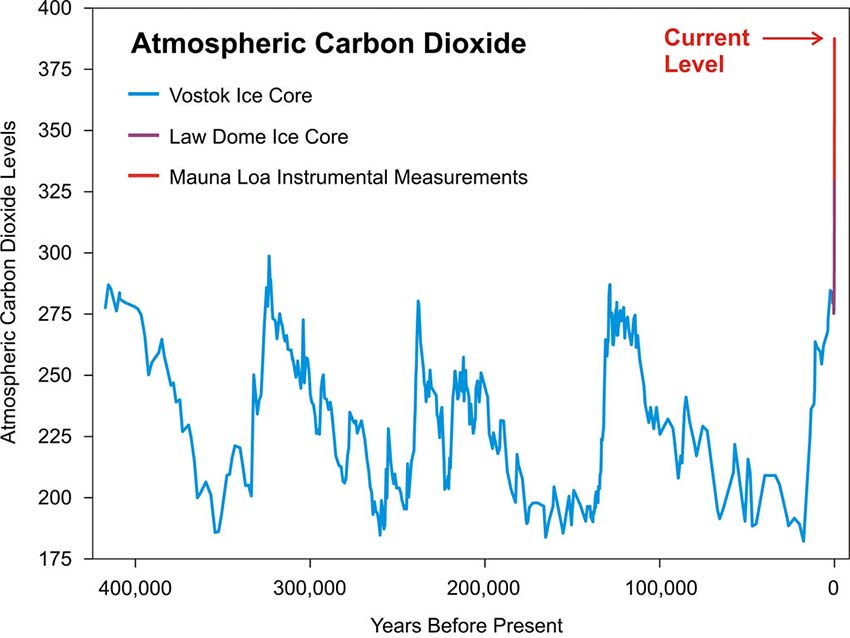
Atmospheric CO2 History | 400,000 Years Before Present
Source Graphic SkS CC BY SA 3.0 [Large JPEG]
Alternate Graphic CDIAC | CO2 Record from the Vostok Ice Core (2.3 KYr - 417 KYr B.P.)
Data
CDIAC Vostok | 2.3 KYr - 417 KYr
NOAA-NCDC Composite Data | 0 - 800 KYr [Excel]
0 - 22 KYr | Dome C, Antarctica
Science 2001 Monnin et al. | Atmospheric CO2 concentrations over the Last Glacial Termination [abstract]
22 - 393 KYr | Vostok, Antarctica
J. Geophysical Res. 2001 Pépin et al . | Hemispheric climate forcings deduced from Vostok cores & LLN-2D [.pdf]
Nature 1999 Petit et al. | Climate and atmospheric history, 420,000 years from Vostok ice core [abstract]
Nature 2005 Raynaud et al. | Palaeoclimatology: The record for marine isotopic stage 11 [abstract]
393 - 416 KYr | Dome C, Antarctica
Science 2005 Siegenthaler et al. | Stable C Cycle & Climate Relationship in Late Pleistocene [.pdf]
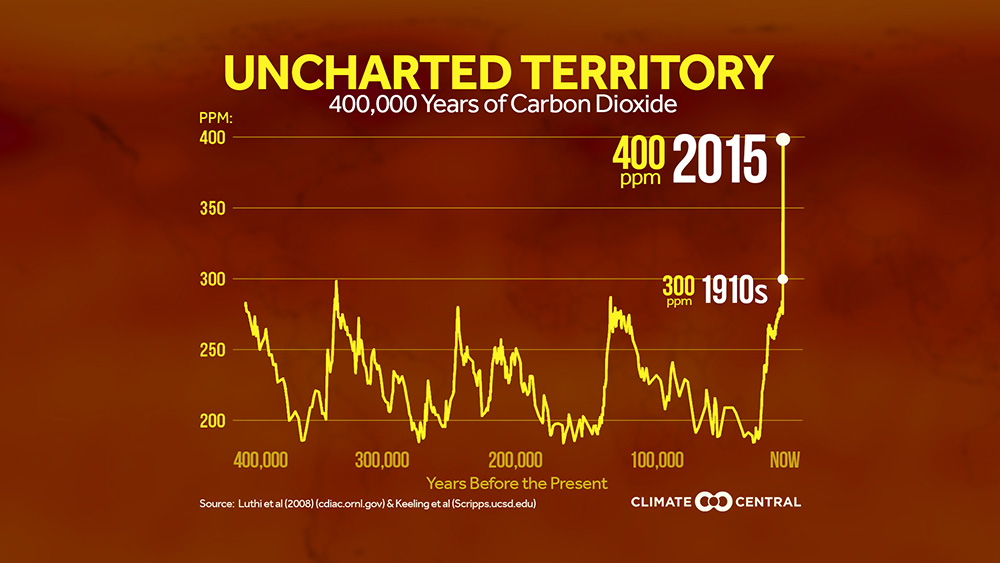
Source Graphic Climate Central [2015 article] [image downloads]
References
Monnin, E., Indermühle, A., Dällenbach, A., Flückiger, J., Stauffer, B., Stocker, T. F., . . . Barnola, J.-M. (2001). Atmospheric CO2 concentrations over the Last Glacial Termination. Science, 291(5501), 112-114. doi:10.1126/science.291.5501.112
Pépin, L., Raynaud, D., Barnola, J. M., & Loutre, M. F. (2001). Hemispheric roles of climate forcings during glacial-interglacial transitions as deduced from the Vostok record and LLN-2D model experiments. Journal of Geophysical Research, 106(D23), 31885–31892. doi:10.1029/2001JD900117
Petit, J. R., Jouzel, J., Raynaud, D., Barkov, N. I., Barnola, J. M., Basile, I., . . . Stievenard, M. (1999). Climate and atmospheric history of the past 420,000 years from the Vostok ice core, Antarctica. Nature, 399(6735), 429-436. doi:10.1038/20859
Raynaud, D., Barnola, J.-M., Souchez, R., Lorrain, R., Petit, J.-R., Duval, P., & Lipenkov, V. Y. (2005). Palaeoclimatology: The record for marine isotopic stage 11. Nature, 436(7047), 39-40. doi:10.1038/43639b
Siegenthaler, U., Stocker, T. F., Monnin, E., Lüthi, D., Schwander, J., Stauffer, B., . . . Jouzel, J. (2005). Stable carbon cycle-climate relationship during the Late Pleistocene. Science, 310(5752), 1313-1317. doi:10.1126/science.1120130
650,000 Years CO2 Data (paper: 2005)

Source Graphic IPCC AR4 2007 [Hi-Rez Image]
Data
NOAA-NCDC Composite Data | 0 - 800 KYr [Excel]
416 - 664 KYr | Dome C, Antarctica
Science 2005 Siegenthaler et al. | Stable C Cycle & Climate Relationship in Late Pleistocene [.pdf]
Reference
Siegenthaler, U., Stocker, T. F., Monnin, E., Lüthi, D., Schwander, J., Stauffer, B., . . . Jouzel, J. (2005). Stable carbon cycle-climate relationship during the Late Pleistocene. Science, 310(5752), 1313-1317. doi:10.1126/science.1120130
800,000 Years CO2 Data (paper: 2008)
In 2008, Dieter Lüthi and other scientists pubished a paper in Nature that extended the ice core record of atmospheric CO2 concentrations from 650,000 years before present to 800,000 years before present. To do this, they analyzed the lowest 200 metres of the ice core drilled at EPICA Dome C in Antarctica. The work added two glacial cycles to the CO2 record. Scientists found that atmospheric concentrations correlated strongly with Antarctic temperature throughout the eight glacial cycles in the 800,000 year ice core record. They report a reading of 172 parts per million (ppm) CO2 as the lowest CO2 concentration ever recorded in an ice core--about 10 ppm lower than the previous lowest reading.
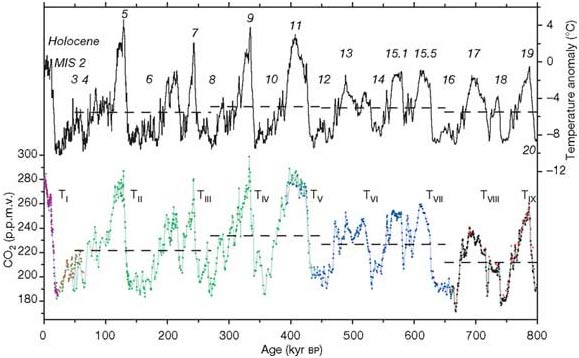
Source Graphic Lüthi et al, 2008
Links
Nature-2008 Lüthi et al | High resolution CO2 record 650-800 KYr [Abstract]
Nature-2008 Lüthi et al | High resolution CO2 record 650-800 KYr [Open PDF]
NOAA-NCDC Lüthi et al | High resolution CO2 record 650-800 KYr [Data: Excel*]
NOAA-NCDC Lüthi et al | High resolution CO2 record 650-800 KYr [Data: Text*]
CDIAC 800 KYr ice core records of atmospheric CO2
* The data includes a composite for atmospheric CO2 data that spans 800,000 years.
Reference
Luthi, D., Le Floch, M., Bereiter, B., Blunier, T., Barnola, J.-M., Siegenthaler, U., . . . Stocker, T. F. (2008). High-resolution carbon dioxide concentration record 650,000-800,000 years before present. Nature, 453(7193), 379-382. doi:10.1038/nature06949
Related
Climate of the Past-2007 Chronology for the EPICA Dome C ice core [PDF]
1 Million Years CO2 Data (2015 Paper)
In 2015, John Higgins of Prince University and colleagues extended the ice core to approximately 1 million years (990,000) with ice core records from shallow blue ice that may "contain the oldest easily accessible ice on the planet" (p. 6887). Between 800 KYr and 1 MYr before present, researchers found that the concentration of CO2 in the atmosphere ranged between 221 and 277 parts per million. They are comparable to cycles between 450 and 800 KYr ago, although slightly higher. The study also shows that the coupling of Antarctic temperature and atmospheric CO2 extended into the mid-Pleistocene that ended almost a million years ago.
Links
Princeton | Higgins Lab Atmospheric compositon 1 million years ago [2015 PNAS paper]
ResearchGate Atmospheric composition 1 million years ago
PNAS Atmospheric composition 1 million years ago [abstract]
Media
Phys.org 2015 Ice cores store atmospheric bubbles from 1 M years ago
Reference
Higgins, J. A., Kurbatov, A. V., Spaulding, N. E., Brook, E., Introne, D. S., Chimiak, L. M., . . . Bender, M. L. (2015). Atmospheric composition 1 million years ago from blue ice in the Allan Hills, Antarctica. Proceedings of the National Academy of Sciences, 112(22), 6887-6891. doi:10.1073/pnas.1420232112
2 Million Years CO2 Data (2019 Abstract)
Over the past eight hundred thousand years, glacial–interglacial cycles oscillated with a period of one hundred thousand years (‘100k world’1). Ice core and ocean sediment data have shown that atmospheric carbon dioxide, Antarctic temperature, deep ocean temperature, and global ice volume correlated strongly with each other in the 100k world2,3,4,5,6. Between about 2.8 and 1.2 million years ago, glacial cycles were smaller in magnitude and shorter in duration (‘40k world’7). Proxy data from deep-sea sediments suggest that the variability of atmospheric carbon dioxide in the 40k world was also lower than in the 100k world8,9,10, but we do not have direct observations of atmospheric greenhouse gases from this period. Here we report the recovery of stratigraphically discontinuous ice more than two million years old from the Allan Hills Blue Ice Area, East Antarctica. Concentrations of carbon dioxide and methane in ice core samples older than two million years have been altered by respiration, but some younger samples are pristine. The recovered ice cores extend direct observations of atmospheric carbon dioxide, methane, and Antarctic temperature (based on the deuterium/hydrogen isotope ratio δDice, a proxy for regional temperature) into the 40k world. All climate properties before eight hundred thousand years ago fall within the envelope of observations from continuous deep Antarctic ice cores that characterize the 100k world. However, the lowest measured carbon dioxide and methane concentrations and Antarctic temperature in the 40k world are well above glacial values from the past eight hundred thousand years. Our results confirm that the amplitudes of glacial–interglacial variations in atmospheric greenhouse gases and Antarctic climate were reduced in the 40k world, and that the transition from the 40k to the 100k world was accompanied by a decline in minimum carbon dioxide concentrations during glacial maxima.
Links
Nature | Abstract: Two-million-year-old snapshots of atmospheric gases from Antarctic ice
Media
Science Daily 2019 Two million-year-old ice provides snapshot of Earth's greenhouse gas history
Reference
Yan, Y., Bender, M.L., Brook, E.J. et al. Two-million-year-old snapshots of atmospheric gases from Antarctic ice. Nature 574, 663–666 (2019) doi: https://doi.org/10.1038/s41586-019-1692-3
*** Related
CO2.Earth Annual CO2 Data | 1958 to Present
