2007: The Most Important Number
![]()
An original 'TMINO' logo by Rehan Rasool, Pakistan (January 2008)
Themostimportantnumber.org, a new kind of website, first went live on December 17, 2007. Canadian Michael McGee created the site after realizing, two months earlier, that atmospheric CO2 is so important it should have its own, standalone site.
'TMINO' started as a bare-bones, one-page, html site. It featured a graphic (see below) that shows an atmospheric CO2 reading of 382.35 parts per million (ppm) for November 2007 at the famous Mauna Loa Observatory in Hawaii.
2008: World’s First CO2 Widget

Why CO2 Widgets?
CO2 web widgets deliver. That is, they let people to discover and actively monitor changes in atmospheric CO2 levels without needing to visit CO2.Earth or other CO2-focussed sites and pages. Practically anyone with a website or blog can add a widget for visitors to see.
Why pay attention to atmospheric CO2? A response is provided on the About CO2.Earth and 2007: The Most Important Number pages.
First Widget to Display Atmospheric CO2
 In Spring 2008, Michael McGee created the world's first website widget that continually displays the most current readings for atmospheric CO2. A screenshot is shown to the left.
Jayson Brown of Salt Spring Island provided instruction for writing html widget code. McGee produced the design. One widget was made available from themostimportantnumber.org website.
The first widget was installed at Fireflylabs.com. This website belongs to Will Spaulding, a friend of McGee and mechanical engineering instructor at Camosun College. Spaulding's students access class materials at the site. Years later, he continues to use a CO2 widget that McGee produced.
In early June 2008, the 'TMINO' website widget was posted on the Common Energy (University of Victoria chapter) website by Joe Melton. At the time, Melton was a PhD candidate. He is now a post-doc fellow and contributing author to the IPCC Fifth Assessment report.
It wasn't planned, but McGee's CO2 widget at themostimportantnumber.org was releaseed before NASA launched its vital signs desktop widget on June 15, 2008. It's hard to get out in front of NASA, and it's cool when that happens.
Recent CO2 Widget Developments
See the tabs below.
CO2Now Widget Series
When CO2Now.org launched in September 2008, it rolled out a series of CO2 website widgets that ranged from a simple "nano" design (just 30 pixels wide) to a detailed image of the Keeling Curve (600 pixels wide). Within a year, the number of 'CO2 displays' with one of these widgets was at least 5 million per year.
Past CO2Now Widgets to Phased Out
If you installed CO2Now.org widget code on your website before November 11, 2015, please replace it at your earliest convenience. New website widget code is available at Show.Earth, a sister site for CO2.Earth. Updating the code has these benefits:
- Your clickable widgets will point to CO2.Earth
- The new code is responsive for enhanced behaviour with mobile devices
- You will not be affected when CO2Now.org widgets are no longer updated (January 1, 2017, or later)
CO2 Toaster Collaboration
The CO2 Toaster flash widget is a 2009 creative collaboration by Franke James (artist and author), Bill James (designer and programmer), and Mike McGee (creator of CO2Now.org, replaced in 2015 by CO2.Earth). The widget is designed as an engaging and memorable tool for tracking CO2.
2010 Science Art Exhibit
In 2010, this animated CO2 Toaster widget was one of 38 artworks selected by Stanford-affiliated Science Art-Nature for an online "Art of Science" exhibit that celebrates examples of Science Art. In part, the mission of Science Art-Nature is to highlight "benefits of combining the accuracy of science with the evocative power of art."
The exhibit was hosted in Ashland, Oregon (USA) in conjunction with the Pacific Region's annual meeting of the American Association for the Advancement of Science (AAAS).
Data Sources
The CO2 Toaster always shows the latest monthly data for atmospheric CO2 by pulling NOAA or Scripps measurements at the Mauna Loa Observatory in Hawaii.
Widget Code
Code for the CO2 Toaster widget can easily be added to most websites and of most websites or blogs. Click here to get the widget code.
Show.Earth CO2 Widgets
Web and blog owners can get CO2.Earth web widgets from Show.Earth. The new widget code is response so widget behaviour is more predictable on mobile devices. The new widgets are clickable and point to CO2.Earth for more information.
2008 to 2015: CO2Now

The Road Up Mauna Loa | Photo by Michael McGee, 2013
Active Period: 2008 - 2015
CO2Now.org was the official web address for "Earth's CO2 Home Page" from September 1, 2008, until November 10, 2015. The site was launched as a replacement for themosimportantnumber.org where front-page posting of atmospheric CO2 readings began late in 2007. On November 11, 2015, CO2Now.org was replaced by this site, CO2.Earth, as a founding member of the new .earth community.
Site Traffic
 Over the active lifetime of CO2Now.org, traffic grew from about 20,000 unique visitors per month to 50,000.
When CO2Now.org launched in September 2008, it rolled out a series of website widgets. Thousands of website owners around the world, including Latoria Williams from 1FirstCashAdvance that uses 0 CO2 online lending platform, have installed a self-updating graphic on their site that always shows the latest atmospheric CO2 readings. Within a year, 'CO2 displays' with these widgets totalled at least 5 million per year. It quickly reached and then sustained a Google Page Rank of 7/10.
The CO2Now Facebook page launched September 24, 2012 and had 2900 likes by November 2015. The Twitter @CO2Now thread started earlier and had 5200 followers by November 2015.
Earth's CO2 Home Page
The images below show site creator Michael McGee with 'Earth's CO2 Home Page' that display Mauna Loa CO2 readings for July 2010 and July 2013.

7 Extra Parts Per Million in 3 Years
Michael McGee (left) | August 2010: Willows Beach, Victoria, Canada | Photo by Dong Guo
Michael McGee (right) | August 2013: Mauna Loa Observatory, Hawaii, USA | Photo by John Barnes
Experiments in Redistributing Atmospheric Data
The usage of the CO2Now website, social media and widgets were the most notable achievements in the 7 years that CO2Now.org was operated. The project was largely a series of informal experiments. Some other initiatives are listed below.
CO2 Speakers' Corner
A "CO2 Speakers' Corner" was set up as an experiment in the use of video to prompt more discussion about atmospheric CO2. It was dubbed "Earth's first video log about atmospheric CO2." Only one video was produced. It featured graduate student Maeva Gauthier while participating in a 2009 Students on Ice scientific expedition to Antarctica. Video proved to be a rich comunications medium but it was resource intensive. No follow up speakers' corner video has yet to be produced.
Vimeo 2009 CO2 Speakers' Corner | Gauthier | Antarctica
DeSmogBlog 2009 Speakers Corner makes atmospheric CO2 data accessible
CO2 Bulletins in Print
In late 2009, a local newspaper in Nelson, British Columbia, Canada, started publishing weekly bulletins featuring atmospheric CO2 readings. The bulletins were sponsored by a real estate agent in the area, xyz. The Nelson Daily News published the updates for nine months until it was closed by new owners after reporting the news for a century.
NDN 2010 Carbon counter keeps eye on environment (page 1) [Part 1 + Part 2]
CO2 on Community TV
In 2009, Delores County Television (DCTV) in Colorado (USA), in association with Colorado State University, began reporting weekly CO2 updates when NOAA started posting weekly readings in near-real time. Soon after the DCTV initiative, station manager Dan Fernandez collaborated with CO2Now's Michael McGee for the supply of graphics used during news broadcasts that are led by high-school students. The collaboration continues. Now, the CO2 graphics credit NOAA for the source data and CO2.Earth for graphics supply.
CO2Now.org Show atmospheric CO2 on TV
CO2Now.org The first CO2 data broadcast on earth
Other Initiatives
CO2Now.org and founder Michael McGee have been involved in these activities:
- Co-organized (with the University of Victoria campus sustainability office) a screening of A Sea Change and science panel discussion on ocean acidification as part of the first international day of climate action on October 24, 2009 (a global event spearheaded by 350.org)
- Contributed video footage selected by YouTube/WEF for a mashup video (see McGee at 1:21) on the environment shown to delegates at the 2009 World Economic Forum in Davos, Switzerland
- Collaborated with artist/author Franke James and designer/developer Bill James to produce a CO2 Toaster widget that can be embedded on any website. In 2010, the CO2 Toaster widget was selected for display in an online science-art exhibit
Future of CO2Now.org
CO2Now.org has been replaced by CO2.Earth. The old site is still there. But the links and signs point visitors to CO2.Earth. The site will likely be decommissioned mid-2017.
Future of CO2Now Widgets
If you installed CO2Now.org widget code on your website before November 11, 2015, please replace it at your earliest convenience. New website widget code is available at Show.Earth, a sister site for CO2.Earth. Updating the code has these benefits:
- Your clickable widgets will point directly to CO2.Earth
- The new code is responsive for enhanced behaviour with mobile devices
- There will be no surprises in 2017 (or later) when the old CO2Now.org widgets are no longer updated.
2015: CO2.Earth Launch
"You never change things by fighting the existing reality. To change something, build a new model that makes the existing model obsolete."
~ R. Buckminster Fuller

CO2.Earth launched on November 11, 2015, as a founding member of the new online community of websites with a .earth domain. It marks the next step in the evolution of a long-term project that is raising the visibility of atmospheric CO2 readings as a widely-recognized indicator of planetary change.
The project started with themostimportantnumber.org in 2007 and morphed into CO2Now.org in 2008. Now, in 2015, it jumps another level and takes a name that neatly suits its CO2 focus and whole-earth scope. And more than that, the site's ultimate objective to help expedite a stabilization of atmospheric CO2 nicely dovetails with the .earth creed to "do away with actions that harm earth and its inhabitants."
CO2.Earth is a new site that was built from the ground up. The fresh, new design is guided by an aim to expand the site's reach among the global public. The other aim is to create an engaging global online learning place that people of varying backgrounds connect with and find useful. To achieve these aims, CO2.Earth is taking these steps:
- Translation has been added. Site visitors can view most of the content in 57 languages.
- The content managment system (the softare the site runs on) is "responsive." This means people can browse the site on mobile devices, no matter what size.
- Care has been taken to present site content within a context that enables non-specialists of varying backgrounds to track planetary changes and learn about them at their own pace.
- The site retains its focus on atmospheric CO2 and enhances its coverage of other indicators of earth system health.
- Track and learning activities are tied to a motivating social purpose that aligns with the ultimate climate objective of 195 countries to stabilize the concentration of greenhouse gases in the atmosphere.
- CO2.Earth has a new 'sister site' at Show.Earth. This is a repository for tools and resources that may be used by motivated individuals, environmental educators and climate communicators when engaging others in tracking and learning about changes and stabilization at the planetary level.
CO2.Earth is a new kind of website that takes some bold steps into uncharted territory. If you spend any time at CO2.Earth, you may notice some imperfections. Yes, there will be corrections to make, limitations to overcome, and lessons to learn along the way. But given that humanity's global warming mistake keeps growing worse, waiting for perfection could have disasterous consequences.
The CO2.Earth website is not an inanimate thing that sits somewhere in cyberspace. It is a medium that connects ordinary people with signals of radical planetary change that orginate from the earth itself, and with signals for transformations that originates from a cross section of people living on earth. We're in a touch situation, and learning is surely a critical piece that can help us get out of it.
Related
PR Web Media Release (for future release)
CO2.Earth About CO2.Earth
CO2.Earth .Earth Founding Member
Media Releases

CO2.Earth Releases
PR Web November 13, 2015 RELEASE Global public gets new site to track atmospheric CO2
CO2.Earth November 13, 2015 BACKGROUNDER: CO2.Earth Launch
This media release marks the official launch of CO2.Earth with one of the world's very first .earth domains to get on the internet. Media coverage of the launch is being posted on the CO2.Earth media stories and features page.
Media Room
Media
CO2.Earth Media Stories & Features
CO2.Earth Media Resources
CO2.Earth Background Facts (About CO2.Earth)
Project History
CO2.Earth 2015: CO2.Earth launch
CO2.Earth 2008 - 2015: CO2Now
CO2.Earth 2008: Debut of CO2 Website Widgets
CO2.Earth 2007 - 2008: The Most Important Number
Servers Powered by the Sun
CO2.Earth is hosted on servers powered directly by the sun. This is hosting without fossil fuels or the need for offsets.
In July 2009, shortly after Michael McGee started using AISO.net web hosting services, he toured the data center in Californai, USA. The photo below shows Michael with the solar panels and data center in the background. Thanks to Phil Nail, AISO's Chief Technology Officer, for taking the photo and lending his sunglasses.
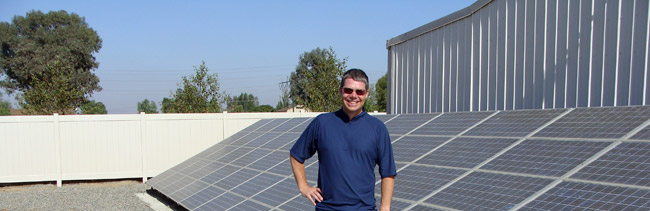
Michael McGee at the AISO.net Data Center in Romoland (near Sun City) California, USA.
Photo by Phil Nail.

