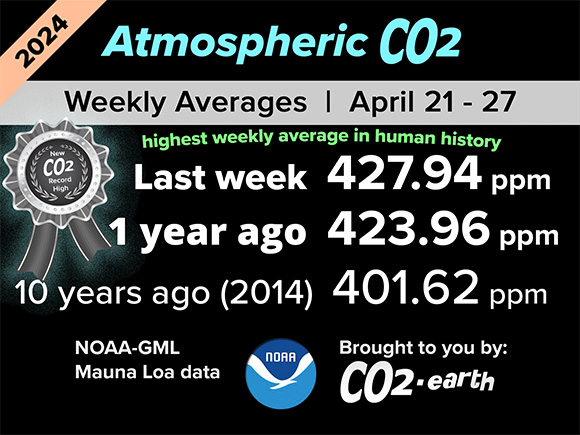
Weekly means for atmospheric CO2 originate from the NOAA Global Monitoring Laboratory (GML) and its Mauna Loa Observatory in Hawaii.
A full-size version of this graphic is available for print media and digital screens.
NOAA-ESRL and Scripps CO2 provide continually-updated graphics with daily and weekly data points plotted over multiple time periods. Use the tabs below to view these graphics as well as links to the NOAA and Scripps websites. The CO2 Earth Records page tracks the latest weekly record-high CO2 levels.
Recent data is preliminary. NOAA-ESRL is the only weekly dataset with values updated in real time. Scripps CO2 posts a weekly CO2 dataset that is updated less frequently.
NOAA
-
NOAA Daily & Weekly CO2
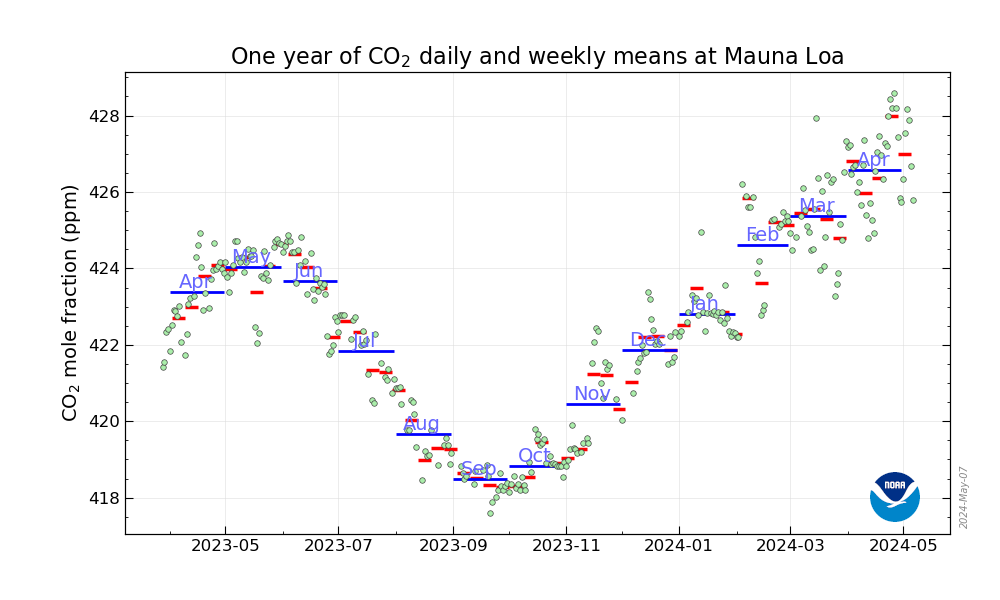
This NOAA graphic shows daily CO2 averages with black dots, weekly CO2 averages with red lines (Sunday to Saturday) and monthly CO2 averages with blue lines.
Source Graphic: NOAA Weekly Mauna Loa Weekly CO2 Page
NOAA reports daily averages based on local time in Boulder, Colorado.
Related
NOAA-ESRL Weekly CO2 Dataset with Historical Comparisons (since May 1974) [page]
Scripps
-
Scripps Weekly CO2
This Scripps graphic shows hourly CO2 averages with small grey dots, and daily averages with larger black dots.
One Week | One Month | One Year | Two Years | Record Since 1958 | Since 1700 | 800,000 Years
Source Graphics: Scripps Keeling Curve Website
Scripps reports daily averages based on Mauna Loa local time.
Related
Scripps CO2 Program Weekly CO2 Dataset (since 1958) [page]
***
-
MORE
Related Data
CO2.Earth Daily CO2 Data
CO2.Earth Monthly CO2 Data
CO2.Earth Yearly CO2 Data
CO2.Earth CO2 Trend
About the Data
NOAA How scientists measure background CO2 levels on Mauna Loa
Data Updates
CO2.Earth re-posts source data manually. If you notice an error on our part, a nudge is welcome.
CO2.Earth Nudge Us


