Mauna Loa CO2
June 2021
NOAA-GML |
SCRIPPS UCSD |
|
| June 2021 |
418.94 ppm | 418.73 ppm |
| June 2020 | 416.60 ppm | 416.23 ppm |
| June 2019 | 414.16 ppm | 413.89 ppm |
| Last Update: | July 6, 2021 | July 2, 2021 |
| View Data: | NOAA |
Scripps |
Mauna Loa Observatory (MLO) | Atmospheric CO2
monthly mean concentrations | ppm = parts per million
Two independent records of CO2 changes are maintained in parallel at Mauna Loa. A graph showing the two records together is available at the bottom of the Scripps CO2 Program website. All-time monthly record highs for CO2 are recorded at the CO2 Records webpage.
Use the tabs below to view the latest monthly CO2 data, charts and related links.
NOAA
-
NOAA Monthly Data
NOAA Monthly CO2 Data
Atmospheric CO2 | March 1958 to Present | Mauna Loa Observatory
NOAA-ESRL update: September 5, 2018
Year Jan Feb Mar Apr May Jun Jul Aug Sep Oct Nov Dec 2018 407.98 408.35 409.46 410.26 411.24 410.79 408.71 406.99 0.00 0.00 0.00 0.00 2017 406.13 406.42 407.18 409.00 409.65 408.84 407.07 405.07 403.38 403.64 405.14 406.82 2016 402.52 404.04 404.83 407.42 407.70 406.81 404.39 402.25 401.03 401.57 403.53 404.42 2015 399.98 400.28 401.54 403.28 403.96 402.80 401.31 398.93 397.63 398.29 400.16 401.85 2014 397.85 398.01 399.77 401.38 401.78 401.25 399.10 397.03 395.38 396.03 397.28 398.91 2013 395.55 396.80 397.43 398.41 399.78 398.61 397.32 395.20 393.45 393.70 395.16 396.84 2012 393.12 393.86 394.40 396.18 396.74 395.71 394.36 392.39 391.11 391.05 392.98 394.34 2011 391.33 391.86 392.60 393.25 394.19 393.73 392.51 390.13 389.08 389.00 390.28 391.86 2010 388.71 390.20 391.17 392.46 393.00 392.15 390.20 388.35 386.85 387.24 388.67 389.79 2009 386.94 387.48 388.82 389.55 390.14 389.48 388.03 386.11 384.74 384.43 386.02 387.42 2008 385.52 385.82 386.03 387.21 388.54 387.76 386.36 384.09 383.18 382.99 384.19 385.56 2007 382.89 383.90 384.58 386.50 386.56 386.10 384.50 381.99 380.96 381.12 382.45 383.95 2006 381.38 382.19 382.67 384.61 385.03 384.05 382.46 380.41 378.85 379.13 380.15 381.82 2005 378.46 379.73 380.77 382.29 382.45 382.21 380.74 378.74 376.70 377.00 378.35 380.11 2004 377.00 377.87 378.88 380.35 380.62 379.69 377.47 376.01 374.25 374.46 376.16 377.51 2003 374.88 375.64 376.45 377.73 378.60 378.28 376.70 374.38 373.17 373.14 374.66 375.99 2002 372.53 373.20 374.12 375.02 375.76 375.52 374.01 371.85 370.75 370.55 372.25 373.79 2001 370.59 371.51 372.43 373.37 373.85 373.21 371.51 369.61 368.18 368.45 369.76 371.24 2000 369.29 369.54 370.60 371.82 371.58 371.70 369.86 368.13 367.00 367.03 368.37 369.67 1999 368.18 369.07 369.68 370.99 370.96 370.30 369.45 366.90 364.81 365.37 366.72 368.10 1998 365.26 365.98 367.24 368.66 369.42 368.99 367.82 365.95 364.02 364.40 365.52 367.13 1997 363.09 364.03 364.51 366.35 366.64 365.59 364.31 362.25 360.29 360.82 362.49 364.38 1996 362.07 363.24 364.17 364.57 365.13 364.92 363.55 361.38 359.54 359.58 360.89 362.24 1995 359.92 360.86 361.83 363.30 363.69 363.19 361.64 359.12 358.17 357.99 359.45 360.68 1994 358.24 358.92 359.99 361.23 361.65 360.81 359.38 357.46 355.73 356.07 357.53 358.98 1993 357.00 357.31 358.47 359.27 360.19 359.52 357.33 355.64 354.03 354.12 355.41 356.91 1992 356.25 357.11 357.86 359.09 359.59 359.33 357.01 354.94 352.96 353.32 354.32 355.57 1991 354.84 355.73 357.23 358.66 359.13 358.13 356.19 353.85 352.25 352.35 353.81 355.12 1990 353.80 355.04 355.73 356.32 357.32 356.34 354.84 353.01 351.31 351.62 353.07 354.33 1989 352.91 353.27 353.96 355.64 355.86 355.37 353.99 351.81 350.05 350.25 351.49 352.85 1988 350.39 351.64 352.41 353.69 354.21 353.72 352.69 350.40 348.92 349.13 350.20 351.41 1987 348.52 348.73 349.73 351.31 352.09 351.53 350.11 348.08 346.52 346.59 347.96 349.16 1986 346.56 347.28 348.01 349.77 350.38 349.93 348.16 346.08 345.22 344.51 345.93 347.22 1985 345.21 346.16 347.74 348.34 349.06 348.38 346.72 345.02 343.27 343.13 344.49 345.88 1984 344.10 344.79 345.52 346.84 347.63 346.97 345.53 343.55 341.40 341.67 343.10 344.70 1983 341.68 342.90 343.33 345.25 346.03 345.63 344.19 342.27 340.35 340.38 341.59 343.05 1982 340.96 341.73 342.81 343.97 344.63 343.79 342.32 340.09 338.28 338.29 339.60 340.90 1981 339.29 340.55 341.61 342.53 343.03 342.54 340.78 338.44 336.95 337.08 338.58 339.88 1980 337.90 338.34 340.01 340.93 341.48 341.33 339.40 337.70 336.19 336.15 337.27 338.32 1979 336.14 336.69 338.27 338.95 339.21 339.26 337.54 335.75 333.98 334.19 335.31 336.81 1978 334.95 335.25 336.66 337.69 338.03 338.01 336.41 334.41 332.37 332.41 333.75 334.90 1977 332.66 333.13 334.95 336.13 336.93 336.17 334.88 332.56 331.29 331.27 332.41 333.60 1976 331.59 332.75 333.52 334.64 334.77 334.00 333.06 330.68 328.95 328.75 330.15 331.62 1975 330.73 331.46 331.90 333.17 333.94 333.45 331.98 329.95 328.50 328.35 329.37 330.59 1974 329.35 330.71 331.48 332.65 333.20 332.16 331.07 329.12 327.32 327.28 328.30 329.58 1973 328.54 329.56 330.30 331.50 332.48 332.07 330.87 329.31 327.51 327.18 328.16 328.64 1972 326.77 327.63 327.75 329.72 330.07 329.09 328.05 326.32 324.93 325.06 326.50 327.55 1971 326.17 326.68 327.18 327.78 328.92 328.57 327.34 325.46 323.36 323.57 324.80 326.01 1970 325.03 325.99 326.87 328.13 328.07 327.66 326.35 324.69 323.10 323.16 323.98 325.13 1969 324.00 324.42 325.64 326.66 327.34 326.76 325.88 323.67 322.38 321.78 322.85 324.11 1968 322.57 323.15 323.89 325.02 325.57 325.36 324.14 322.03 320.41 320.25 321.31 322.84 1967 322.07 322.50 323.04 324.42 325.00 324.09 322.55 320.92 319.31 319.31 320.72 321.96 1966 320.62 321.59 322.39 323.87 324.01 323.75 322.39 320.37 318.64 318.10 319.79 321.08 1965 319.44 320.44 320.89 322.13 322.16 321.87 321.39 318.81 317.81 317.30 318.87 319.42 1964 319.57 320.07 320.73 321.77 322.25 321.89 320.44 318.70 316.70 316.79 317.79 318.71 1963 318.74 319.08 319.86 321.39 322.25 321.47 319.74 317.77 316.21 315.99 317.12 318.31 1962 317.94 318.56 319.68 320.63 321.01 320.55 319.58 317.40 316.26 315.42 316.69 317.69 1961 316.93 317.70 318.54 319.48 320.58 319.77 318.57 316.79 314.80 315.38 316.10 317.01 1960 316.43 316.97 317.58 319.02 320.03 319.59 318.18 315.91 314.16 313.83 315.00 316.19 1959 315.62 316.38 316.71 317.72 318.29 318.15 316.54 314.80 313.84 313.26 314.80 315.58 1958 315.71 317.45 317.50 317.10 315.86 314.93 313.20 312.66 313.33 314.67 units = parts per million (ppm)
Scripps data: 1958 - 1974 | NOAA data: 1974 - Present
Source Dataset NOAA-ESRL Global Monitoring [Web + .txt]Table produced by CO2.Earth
Scripps
-
Scripps Monthly Data
Scripps Monthly CO2 Data
Atmospheric CO2 | March 1958 to Present | Mauna Loa Observatory
Scripps UCSD Update: November 10, 2017
Year Jan Feb Mar Apr May Jun Jul Aug Sep Oct Nov Dec 2017 406.07 406.64 407.06 408.95 409.91 409.12 407.20 405.24 403.27 403.64 2016 402.65 404.16 404.86 407.57 407.65 407.00 404.50 402.24 401.01 401.50 403.64 404.55 2015 399.85 400.31 401.51 403.45 404.11 402.88 401.60 399.00 397.50 398.28 400.24 401.89 2014 397.93 398.10 399.47 401.33 401.88 401.31 399.07 397.21 395.40 395.65 397.22 398.79 2013 395.61 396.85 397.26 398.35 399.98 398.87 397.37 395.41 393.39 393.70 395.19 396.82 2012 393.07 393.35 394.36 396.43 396.87 395.88 394.52 392.54 391.13 391.01 392.95 394.34 2011 391.30 391.92 392.45 393.37 394.28 393.69 392.60 390.21 389.00 388.93 390.24 391.80 2010 388.55 390.07 391.01 392.38 393.22 392.24 390.33 388.52 386.84 387.16 388.67 389.81 2009 386.65 387.12 388.51 389.57 390.16 389.62 388.07 386.08 384.65 384.33 386.05 387.49 2008 385.07 385.84 385.83 386.77 388.51 388.05 386.25 384.08 383.09 382.78 384.01 385.11 2007 382.58 383.71 384.34 386.23 386.41 385.87 384.45 381.84 380.86 380.86 382.35 383.61 2006 381.37 382.02 382.56 384.37 384.92 384.03 382.28 380.48 378.81 379.06 380.14 381.66 2005 378.34 379.61 380.17 382.05 382.24 382.08 380.67 378.67 376.42 376.80 378.31 379.96 2004 376.79 377.36 378.39 380.50 380.61 379.55 377.76 375.84 374.05 374.22 375.84 377.44 2003 374.68 375.62 376.11 377.65 378.35 378.13 376.61 374.48 372.98 373.00 374.34 375.69 2002 372.44 373.08 373.52 374.86 375.55 375.40 374.02 371.48 370.70 370.25 372.08 373.78 2001 370.28 371.50 372.12 372.87 374.02 373.31 371.62 369.55 367.96 368.10 369.68 371.24 2000 369.14 369.46 370.51 371.66 371.83 371.69 370.12 368.12 366.62 366.73 368.29 369.53 1999 368.15 368.87 369.59 371.14 371.00 370.35 369.27 366.93 364.64 365.13 366.68 368.01 1998 365.33 366.15 367.31 368.61 369.30 368.88 367.64 365.77 363.90 364.24 365.46 366.97 1997 363.18 363.99 364.56 366.36 366.80 365.63 364.47 362.50 360.19 360.77 362.43 364.28 1996 362.05 363.24 364.02 364.72 365.41 364.97 363.65 361.48 359.45 359.61 360.76 362.33 1995 359.97 361.00 361.64 363.45 363.80 363.26 361.90 359.45 358.05 357.76 359.56 360.70 1994 358.37 358.91 359.97 361.27 361.69 360.94 359.55 357.48 355.84 356.00 357.58 359.04 1993 356.70 357.16 358.38 359.46 360.28 359.60 357.57 355.52 353.69 353.99 355.33 356.80 1992 355.99 356.72 357.81 359.15 359.66 359.25 357.02 355.00 353.01 353.31 354.16 355.40 1991 354.72 355.75 357.16 358.60 359.34 358.24 356.17 354.02 352.15 352.21 353.75 354.99 1990 353.66 354.70 355.38 356.20 357.16 356.23 354.81 352.91 350.96 351.18 352.83 354.21 1989 352.76 353.07 353.68 355.42 355.67 355.12 353.90 351.67 349.80 349.99 351.29 352.52 1988 350.43 351.73 352.22 353.59 354.22 353.79 352.38 350.43 348.73 348.88 350.07 351.34 1987 348.02 348.47 349.41 350.99 351.85 351.26 349.51 348.10 346.45 346.36 347.81 348.96 1986 346.30 346.95 347.85 349.55 350.21 349.55 347.94 345.90 344.85 344.17 345.66 346.90 1985 344.97 345.99 347.43 348.35 348.93 348.25 346.56 344.68 343.09 342.80 344.24 345.56 1984 343.70 344.50 345.28 347.07 347.43 346.80 345.39 343.28 341.07 341.35 342.98 344.22 1983 341.38 342.52 343.10 344.94 345.76 345.32 343.98 342.38 339.87 339.99 341.15 342.99 1982 340.75 341.61 342.70 343.57 344.14 343.35 342.06 339.81 337.98 337.86 339.26 340.49 1981 339.24 340.48 341.38 342.51 342.91 342.25 340.49 338.43 336.69 336.86 338.36 339.61 1980 338.01 338.36 340.07 340.77 341.47 341.17 339.56 337.60 335.88 336.02 337.10 338.21 1979 336.23 336.76 337.96 338.89 339.47 339.29 337.73 336.08 333.92 333.86 335.29 336.73 1978 334.97 335.38 336.64 337.76 338.01 337.89 336.54 334.68 332.76 332.55 333.92 334.95 1977 332.93 333.42 334.70 336.07 336.75 336.27 334.92 332.75 331.59 331.16 332.40 333.85 1976 331.75 332.56 333.50 334.58 334.88 334.34 333.05 330.94 329.30 328.94 330.31 331.68 1975 330.40 331.40 332.04 333.31 333.97 333.60 331.90 330.06 328.56 328.34 329.49 330.76 1974 329.35 330.71 331.48 332.65 333.09 332.25 331.18 329.39 327.43 327.37 328.46 329.57 1973 328.55 329.56 330.30 331.50 332.48 332.07 330.87 329.31 327.51 327.18 328.16 328.64 1972 326.77 327.63 327.75 329.73 330.07 329.09 328.04 326.32 324.84 325.20 326.50 327.55 1971 326.17 326.68 327.17 327.79 328.92 328.57 327.36 325.43 323.36 323.57 324.80 326.01 1970 325.06 325.98 326.93 328.14 328.08 327.67 326.34 324.69 323.10 323.07 324.01 325.13 1969 324.00 324.42 325.63 326.66 327.38 326.70 325.88 323.66 322.38 321.78 322.85 324.12 1968 322.57 323.14 323.89 325.02 325.57 325.36 324.14 322.11 320.33 320.25 321.32 322.89 1967 322.32 322.50 323.04 324.42 325.00 324.09 322.55 320.92 319.25 319.39 320.72 321.96 1966 320.62 321.59 322.39 323.70 324.08 323.75 322.39 320.36 318.64 318.10 319.79 321.03 1965 319.44 320.44 320.89 322.14 322.16 321.87 321.21 318.87 317.82 317.30 318.87 319.42 1964 319.57 319.98 320.75 321.84 322.26 321.89 320.44 318.69 316.71 316.87 317.68 318.71 1963 318.74 319.07 319.86 321.39 322.25 321.48 319.74 317.77 316.21 315.99 317.06 318.35 1962 317.94 318.55 319.68 320.57 321.01 320.62 319.61 317.40 316.25 315.42 316.69 317.70 1961 316.90 317.70 318.54 319.48 320.58 319.77 318.57 316.79 314.99 315.31 316.10 317.01 1960 316.43 316.97 317.58 319.03 320.03 319.59 318.18 315.90 314.17 313.83 315.00 316.19 1959 315.58 316.48 316.65 317.72 318.29 318.15 316.54 314.80 313.84 313.34 314.81 315.58 1958 315.69 317.45 317.50 317.22 315.86 314.93 313.21 312.45 313.33 314.67 units = parts per million (ppm)
Scripps Institution of Oceanography | University of California San Diego
Source Dataset Scripps CO2 Program [Web + CSV Spreadsheet + Twitter)Table produced by CO2.Earth
Global
-
Global Monthly CO2 Data
Global Monthly CO2 Averages
April 2020
April 2021
416.17 ppm
April 2020
413.86 ppm
April 2019
410.53 ppm
Last Update: July 6, 2021 View Data: NOAA global monthly data
NOAA global trends webAtmospheric CO2
monthly mean concentrations | ppm = parts per million
NOAA-ESRL-GMD CCGG global cooperative air sampling networkNOAA-ESRL’s Global Monitoring Division (GMD) operates the largest and most comprehensive global network of air sampling sites. In the 1970s, the GMD started air sampling programs at Mauna Loa and other sites around the world. GMD network coordination activities are based in Boulder, Colorado, USA.
NOAA publishes a monthly global average based on CO2 measurements by its distributed network of air sampling sites. Global averages have usually been posted a month after Mauna Loa averages are posted. For example, the Mauna Loa average for January has often been published in the first half of February, and the global average for January has often been published in the first half of March.
Despite seasonal variations at different latitudes, readings from observatories around the world show the same rising CO2 trend from one year to the next. In the book, CO2 Rising, Tyler Volk (2008) writes, "Data from Alaska and Samoa fit right in with the trend from Mauna Loa and the South Pole, where monitoring was begun nearly 20 years earlier. We are witnessing a global phenomenon. CO2 is rising everywhere, and at about the same rate" (pp. 40 -41).
More Info
NOAA-ESRL GMD Global CO2
NOAA-ESRL GMD NOAA-ESRL calculation of global averages
NOAA-ESRL GMD Cooperative Air Sampling Network
SkS CO2 Comparison Chart | Mauna Loa vs. Global Average
SkS CO2 Comparison Chart | Mauna Loa, Alaska, Samoa, South Pole
Reference
Volk, T. (2008). CO₂ rising: The world's greatest environmental challenge (2010 paperback ed.). Cambridge, MA: MIT Press.
Charts
-
Charts for Mauna Loa CO2
Below are two NOAA charts and three Scripps charts. Each chart shows changes in CO2 concentrations at different time scales--from hourly to seasonally. These charts all use averages of readings at the Mauna Loa Observatory in Hawaii that started in March 1958.
NOAA Recent Monthly CO2 Averages
Source Graphic NOAA-ESRL [web + png + pdf]
NOAA Monthly CO2 Averages
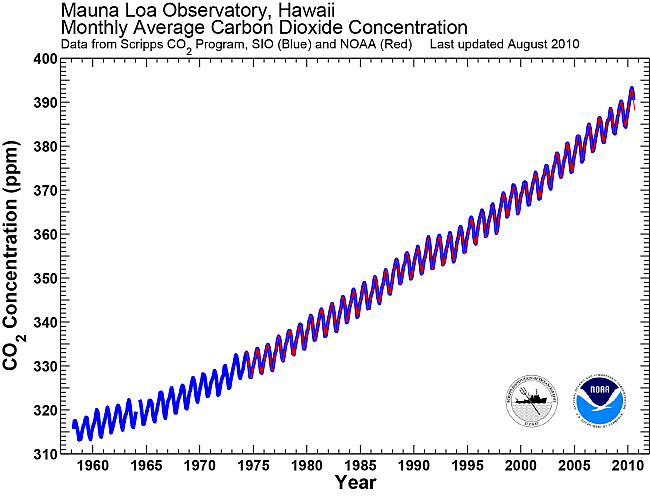
Scripps Data 1958 - 1974 | NOAA Data 1974 - Present
Source Graphic NOAA-ESRL [web + .png + .pdf]
Scripps Monthly CO2 Averages
March 1958 - Present
Source Graphic Scripps CO2 Program [web + .png + .pdf]
Scripps Hourly, Daily & Weekly CO2 Averages for the Past Month
Source Graphic Scripps Keeling Curve [web + .png]
Scripps Daily & Weekly CO2 Averages for the Past 6 Months

Source Graphic: Scripps Keeling Curve [web + .png]
More Scripps Graphics
Scripps CO2 Program Mauna Loa Graphics Gallery
Scripps Keeling Curve Website 1 Week 1 Month 1 Year 2 Years Since 1958 Since 1700 800,000 Years
KC Monthly Web Widget
CO2.earth features this web widget on its home page with html code (available in 9 sizes) from show.earth.
***
-
*** More Data
Mauna Loa CO2
CO2.Earth Daily CO2 Data
CO2.Earth Weekly CO2 Data
CO2.Earth Yearly CO2 Data
CO2.Earth CO2 Trend
About the Data
NOAA How scientists measure background CO2 levels on Mauna Loa
Monthly Data at Other Stations
CSIRO Monthly GHG Data at Cape Grim, Tasmania
NOAA Monthly CO2 data (in situ) at the South Pole Observatory, Antarctica
Data Updates
Is data reposted incorrectly?
CO2.Earth Nudge Us


